| Name | |
| Sandra Romero Hidalgo | sromero@inmegen.gob.mx |
| Alessandra Carnevale Cantoni | acarnevale@inmegen.gob.mx |
| Juan Carlos Fernández López | jfernandez@inmegen.gob.mx |
| Lorena Sofía Orozco Orozco | lorozco@inmegen.gob.mx |
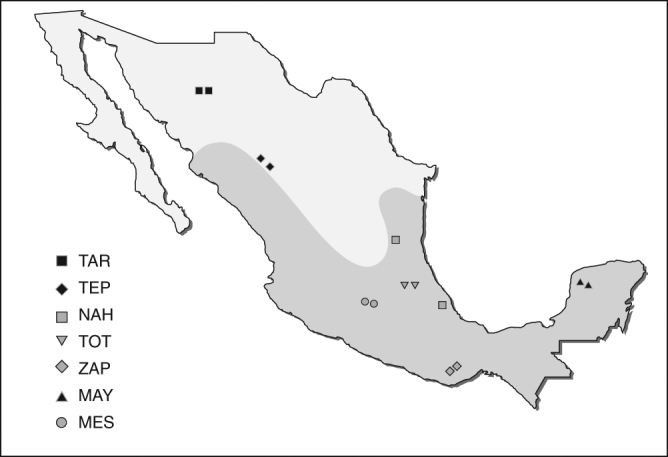
Map of Mexico. The figure shows the geographical origin of each NA and unrelated Mestizo individuals included in the present study. The region of Mesoamerica is shaded in gray. TAR (Tarahumara), TEP (Tepehuano), NAH (Nahua), TOT (Totonaca), ZAP (Zapoteca), MAY (Maya), and MES (Mestizo)
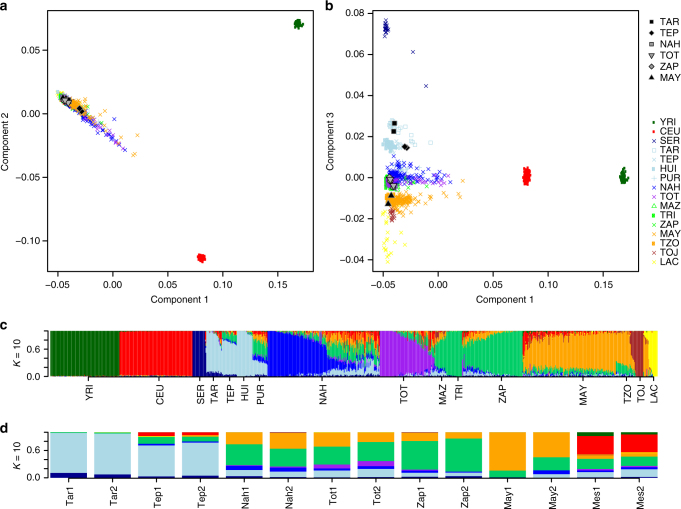
Multidimensional scaling plots and admixture analysis. a MDS plot for components 1 and 2 of 12 Native Americans of Mexico combined with continental (CEU and YRI from HapMap) and NA reference populations. b MDS plot for components 1 and 3, separating the NA populations of Mexico. The 12 sequenced NA samples are shown in gray, and population labels are as described in Supplementary Table 8. c Global ancestry proportions of NA and continental reference populations assuming K=10. d Global ancestry proportions of the 12 NA individuals assuming K=10. The NA individuals are displayed North-to-South, and the Mestizo individuals are displayed at the far right. Tar1 and Tar2 (Tarahumara), Tep1 and Tep2 (Tepehuano), Nah1 and Nah2 (Nahua), Tot1 and Tot2 (Totonaca), Zap1 and Zap2 (Zapoteca), May1 and May2 (Maya), Mes1 and Mes2 (Mestizo)